For groups that own hotels, restaurants, and shops
IntroducingHospitality AI
One brain under the group. The numbers, the sites, the books, and the people who used to wait on Excel — together, so a decision can be made this week.
Group · Overview
Last 7 days · example
Net sales
$184,220
+6.2%
Checks
2,841
Avg check
$65
Covers
4,102
Net sales by venue
Hotel 1 labour
16%
vs 25–35% · Pivot
Restaurant 2 break-even
$21,813
this week
Site traffic
31.2k
4.8k → Jul · +146%
Contents
What we’ll walk through today.
The problem
The numbers sat on separate platforms. Decisions slowed. The group was harder to see.
Each hotel, restaurant, and shop ran its own stack. Sales in Veloce. Labour in Pivot. Invoices in Gmail. Books in QuickBooks, closed when the accounting director finished typing.
The ops director built the weekly Excel by hand. Without that sheet, there was almost no picture. With it, there was a top line: useful, late, and still not enough to staff a Tuesday or challenge a room’s numbers.
As it stood
Before the board
2–6 wks
P&L after the week
A clean pack, two to six weeks late.
By hand
Weekly Excel
The ops director rebuilt the picture every week.
None
Same-week group view
No one screen for every room.
4
Independent stacks
Veloce · Pivot · Gmail · QBO.
The AI brain
Hospitality Group’s ontology. Every source under one roof.
The brain is not a chatbot. It is the map of the business: POS, QuickBooks, hours, invoices, sites, and CRM, named the same way across every room. The dashboard, the employees, and the studio all sit on top of that map.
Once the information is together, a question like “what did Restaurant 2 do this week, and what did it cost?” has one place to live.
What it returns
Faster decisions. Lower operating drag. More of the week turning into profit.
Hospitality groups usually see a clean P&L two to six weeks late. That delay is expensive: hours left on the floor, invoices sitting in a pile, a menu that cannot ship until a photographer is free.
Combining the sites and restructuring the information moves demand: more people finding the rooms, more of them reserving a table or a stay, and more time spent on the menus. Google and ChatGPT mentioning the rooms far more than before. Newsletters on top of that.
Faster
Time to a decision
The week on the board, instead of waiting for close around the 15th. Industry still runs on month-end packs.
Reduce
Operational costs
Labor and food on one board, so the week can be challenged while it is still the week.
Increase
Website traffic and Reservations
More people finding the rooms, and more of them reserving a table or a stay.
The dashboard
This is where every room sits on one map, so you can read the same week without waiting for a pack on the 15th.
The brain is how we name the business. This screen is where those names land, read as one week.
When those names agree, you can still see Thursday while it is Thursday: Hotel 1 next to Restaurant 2 next to Hotel 2. You can see covers, a dish, a quiet hour, and labour against the till.


 Pivot
Pivot


Sales · Overview
Last 7 days · example
Net sales
$184,220
+6.2%
Checks
2,841
+3.1%
Avg check
$65
+1.4%
Covers
4,102
+4.8%
Net sales by venue
Hotel 1 · week
Last 7 days · example
Supper club. Saturday is still the night that fills the room.
Sales
$79,400
Costs
$33,348
Plates
1,240
Profit
$46,052
Best-selling plate
Ribeye 10 oz · 186
The ribeye 10 oz sold 41 more plates than the Cornish hen this week.
Restaurant 1 · week
Last 7 days · example
Steak house. A small-plate special runs from 16h to 19h.
Sales
$52,100
Costs
$28,134
Plates
980
Profit
$23,966
Best-selling plate
Steak frites · 241
Steak frites sold 94 more plates than the double cheeseburger this week.
Restaurant 2 · week
Last 7 days · example
Terrace room. The house pour is $6 a glass.
Sales
$21,520
Costs
$12,266
Plates
680
Profit
$9,254
Best-selling plate
Butcher’s plate · 94
The house pour sold 186 more glasses than the house white this week.
Hotel 2 · week
Last 7 days · example
Grill room. Small plates come first, then the main.
Sales
$31,200
Costs
$16,536
Plates
820
Profit
$14,664
Best-selling plate
Grill plate · 128
The grill plate sold 37 more than the chicken plate this week.
Cross-analytics
POS × hours · example
Hotel 1 · Saturday vs Sunday
Saturday made 31% of sales for the week. Sunday used almost the same hours and made 14%.
Restaurant 2 · terrace vs kitchen
The terrace made 41% of the week at Restaurant 2 in 22% of the hours. After 21h, the kitchen is slower than the floor.
Restaurant 1 · oysters vs hours
From 16h to 19h, oyster volume was up 28% this week, while floor hours were only up 4%.
AI assistant · flag
Restaurant 2 · Tuesday · example
Red flag
Hey — you had a lot more people working at Restaurant 2 today than the sales needed, and the projections had already said you did not need that many people on the floor. Estimated impact is $1,840 in extra labour that you did not need to spend.
Solution
Review your projections page, where it shows what we believe this week should look like before you write the floor schedule.Sales
The AI assistant reads who is coming, how often they return, which plates are selling, and what the tips say. Cross-analytics to increase sales and run each room more efficiently.
Each hotel, restaurant, and shop has its own card. The months run across the card. September sales, food, labor, and the break-even line sit under them.
Hotel 1 is still below its line. The other rooms are above it. You read that here, with the sales, instead of in a second workbook.
The group
One dashboard · Apr–Sep
September · group
$878k
Sales, food, labor, and break-even for every property, in one AI brain.
Hotel 1
Below the line
$344k
September sales
Apr
$282k
May
$296k
Jun
$310k
Jul
$323k
Aug
$334k
Sep
$344k
Food
$89k
Labor
$55k
Break-even
$406k
Restaurant 1
Above the line
$226k
September sales
Apr
$185k
May
$194k
Jun
$203k
Jul
$212k
Aug
$219k
Sep
$226k
Food
$68k
Labor
$54k
Break-even
$194k
Restaurant 2
Above the line
$93k
September sales
Apr
$76k
May
$80k
Jun
$84k
Jul
$88k
Aug
$90k
Sep
$93k
Food
$27k
Labor
$26k
Break-even
$87k
Hotel 2
Above the line
$135k
September sales
Apr
$111k
May
$116k
Jun
$122k
Jul
$127k
Aug
$131k
Sep
$135k
Food
$42k
Labor
$30k
Break-even
$131k
Shop 1
Above the line
$80k
September sales
Apr
$65k
May
$69k
Jun
$72k
Jul
$75k
Aug
$77k
Sep
$80k
Food
$22k
Labor
$18k
Break-even
$50k
P&L
All of your venues and properties under one AI Brain. Automatically generated.
Automatically generated. No one retypes the week into Excel. Revenue, cost of sales, labour, occupancy, the rest of operating cost, and EBITDA sit in one AI brain, for every venue and property, while the week is still open.
Group EBITDA this week is $69,279. Hotel 1 carries the largest share. Restaurant 2 and Shop 1 are on the same statement, not in a side file.
P&L · this week
All of your venues and properties under one AI Brain. Automatically generated.
| Line | Group | Hotel 1 | Restaurant 1 | Restaurant 2 | Hotel 2 | Shop 1 |
|---|---|---|---|---|---|---|
| Revenue | $202,620 | $79,400 | $52,100 | $21,520 | $31,200 | $18,400 |
| Cost of sales | $57,155 | $20,644 | $15,630 | $6,241 | $9,672 | $4,968 |
| Gross profit | $145,465 | $58,756 | $36,470 | $15,279 | $21,528 | $13,432 |
| Labour | $42,330 | $12,704 | $12,504 | $6,026 | $6,864 | $4,232 |
| Occupancy | $24,656 | $8,734 | $6,773 | $3,013 | $3,744 | $2,392 |
| Other operating | $9,200 | $3,600 | $2,400 | $1,000 | $1,400 | $800 |
| EBITDA | $69,279 | $33,718 | $14,793 | $5,240 | $9,520 | $6,008 |
Revenue through EBITDA, for every venue and property, in one AI brain. The statement writes itself from the till and the books.
Costs
AI reviews your costs and creates cross-analytics to help you reduce operational costs.
Food, labour, occupancy from QuickBooks, not from a guess. If the POS and the books disagree, the gap shows up in the week it happens.
Costs · July
QuickBooks
Hotel 1 labour
Last 30 days · Pivot
16%
Industry sits at 25–35%. This 16% is Pivot. Payroll, benefits, and insurance live in QuickBooks — same screen, once those journals are on the board.
Costs · This week
Per venue · example
Week net · Hotel 1
$79,400
Group 28% · -2 pts
Group 21% · -5 pts
Group 12% · -1 pts
Group 49% · -7 pts
Labour 16% vs group 21% · -5 pts · same 16% as Pivot
Rooms this week · % of net
| Venue | Food | Labour | Occ. | Prime |
|---|---|---|---|---|
| Hotel 1 | 26% | 16% | 11% | 42% |
| Restaurant 1 | 30% | 24% | 13% | 54% |
| Restaurant 2 | 29% | 28% | 14% | 57% |
| Hotel 2 | 31% | 22% | 12% | 53% |
| Shop 1 | 27% | 23% | 13% | 50% |
| Hospitality Group | 28% | 21% | 12% | 49% |
Hours
Which hours sell. Which hours do not.
Staffing used to be a feeling. The heatmap is that feeling with numbers: rooms that die at 15h, rooms that run late, and the hours where a cut shows up against sales.
Hours · heatmap
Net sales by venue × hour
Group by hour
Selected week
Break-even
We look at the last twelve months, and at the last two years, of what each room needed to break even on each day. Then we set those lines next to this week and today.
Restaurant 2 needs $21,813 this week. That is not a vibe, and it is not a number you wait to learn on the 15th. It is a daily line from the books that you can open, challenge, and set next to the same day last year.
Break-even · Restaurant 2
This week
Sales to clear the week
$21,813
Above · +$2,300 this week
78% of the week already in
This is the sales Restaurant 2 needs to clear this week. The room is above the line by $2,300, and 78% of the week is already in.
Break-even · Hotel 1
This week · example
Sales to clear the week
$101,400
Below · -$22,000 this week
78% of this week’s line
Hotel 1 needs $101,400 this week, from the trailing twelve months of closed books. Sales this week are $79,400, so the room is below the line. In 2023 the same week asked about $142,000. We do not average those years.
Break-even · Restaurant 1
This week · example
Sales to clear the week
$48,600
Above · +$3,500 this week
100% of this week’s line
Restaurant 1 needs $48,600 this week. Sales this week are $52,100, so the room is above the line by $3,500.
Break-even · Hotel 2
This week · example
Sales to clear the week
$32,800
Below · -$1,600 this week
95% of this week’s line
Hotel 2 needs $32,800 this week. Sales this week are $31,200, so the room is below the line by $1,600.
Break-even · This week
Per venue · daily line
Week line · Restaurant 2
$21,813
This week’s sales against the daily line
Each day’s break-even is this week’s line, spread across the seven days, then set next to the same week in the trailing twelve months and in the last two years. Restaurant 2’s $21,813 is the real figure for this week.
History next to this week · Restaurant 2
Above · +$2,300
Sales this week $24,113 against a line of $21,813.
| Venue | This week | 12 mo | 2 yr |
|---|---|---|---|
| Hotel 1 | $101,400 | $101,400 | $142,000 |
| Restaurant 1 | $48,600 | $48,600 | $52,000 |
| Restaurant 2 | $21,813 | $20,940 | $19,200 |
| Hotel 2 | $32,800 | $32,800 | $31,000 |
| Hospitality Group | $204,613 | $203,740 | $244,200 |
Projections
This is the same idea, written forward: sales projections, cost projections, and break-even projections, for each room. Last year is the floor.
At Restaurant 2, the current read is revenue up about 9% and costs up about 4%. The extra sales are not being bought with a matching jump in spend. You can take a lever off and watch the three lines move together.
Restaurant 2 · Autumn
Last year is the floor
Forward from last year
Sales
+9% vs last year
$21,520
Costs
+4% vs last year
$15,280
Break-even
vs last year $20,200
$21,813
Current read at Restaurant 2: revenue up about 9%, costs up about 4%. Last year is the floor. The break-even for this week stays $21,813.
Hotel 1 · Autumn
Last year is the floor · example
Forward from last year
Sales
+6% vs last year
$79,400
Costs
+2% vs last year
$48,000
Break-even
vs last year $118,000
$101,400
Sales are written about 6% above last year. Costs stay close to last year. Break-even uses the trailing twelve months, not the 2023 line of about $142,000 a week.
Restaurant 1 · Autumn
Last year is the floor · example
Forward from last year
Sales
+5% vs last year
$52,100
Costs
+3% vs last year
$34,100
Break-even
vs last year $50,200
$48,600
Restaurant 1’s sales projection sits about 5% above last year, and costs about 3% above last year. Break-even is a little easier than last autumn because labour is the line we watch.
Hotel 2 · Autumn
Last year is the floor · example
Forward from last year
Sales
+7% vs last year
$31,200
Costs
+5% vs last year
$21,100
Break-even
vs last year $31,800
$32,800
Hotel 2’s sales projection sits about 7% above last year, and costs about 5% above last year. Break-even moves with that cost line, not with a guess for autumn covers.
Projections · Autumn
Per venue · last year is the floor
Projected week · Restaurant 2
$21,520
Sales
$21,520
Last year $19,740 · +9%
Costs
$15,280
Last year $14,690 · +4%
Break-even
$21,813
Last year $20,200
Current read at Restaurant 2: revenue up about 9%, costs up about 4%. Last year is the floor. Seasonal pace, city dining week, and cruise traffic sit on the model, and each of those levers can be switched off.
Rooms this autumn · vs last year
| Venue | Sales | Costs | Break-even |
|---|---|---|---|
| Hotel 1 | $79,400+6% | $48,000+2% | $101,400 |
| Restaurant 1 | $52,100+5% | $34,100+3% | $48,600 |
| Restaurant 2 | $21,520+9% | $15,280+4% | $21,813 |
| Hotel 2 | $31,200+7% | $21,100+5% | $32,800 |
| Hospitality Group | $184,220+6% | $118,480+3% | $204,613 |
The AI layer
The AI assistant is constantly monitoring your operations and will notify you if there is a red flag. It will give you a solution so you can keep operational costs as low and efficient as possible.
Cross-analytics on the same map: labour against sales, hour against hour, invoice mix against food cost. The board does not just report. It raises a hand when a room drifts.
AI assistant · flag
Hotel 2 · Wednesday · example
Red flag
Hotel 2 had nine people on the floor last night against a projection of six. Sales cleared the line, but labour still ran $1,260 over what the week needed.
Solution
Review the projections page and write tomorrow’s Hotel 2 floor against that number, not last night’s habit.AI assistant · flag
Hotel 1 · weekday · example
Red flag
From 15h to 17h at Hotel 1, sales are down 18% this week while hours are up 6%. The dead window is costing the room on a quieter afternoon.
Solution
Cut the 15h–17h floor at Hotel 1. The hours heatmap shows the same gap.AI assistant · flag
Restaurant 1 · this week · example
Red flag
Food cost at Restaurant 1 is up 1.4 points week over week. The till did not move with it, so the extra is sitting in this week’s invoices.
Solution
Check this week’s invoice mix on the board before the next Sysco drop.The AI workforce
AI Employees for Hospitality Group
Reception, reservations, marketing, the studio, culinary, inventory, books, and accounting.
AI receptionist
Answers the phone, takes questions about the rooms, and books a table any hour.
Test the live receptionistAI reservations taker
Takes the party size, the time, and the room, and writes the booking down.
AI for marketing
Plans the campaigns and the calendar across the hotels, restaurants, and shops.
AI studio
Reduce photography costs and increase conversions. A new dish does not wait on a photographer.
Marketing content
Creates the posts from images of your locations and your plates.
Culinary
Works the recipes and the menus so the plates that sell stay, and the quiet ones get rewritten.
Inventory
Watches what is on hand, what to order next, and what is going to waste.
Books
Reads each invoice, names the vendor and the account, and lines it up for the books.
Accounting
Simplifies the close and speeds up the week of typing, invoices, and the month-end pack.
And more.
New AI employee: Accounting assistant
A new AI employee is launching October 1st and is made to simplify and speed up your accounting.
Books opens the PDF and names the vendor, the account, and the tax. It can tell an invoice from a statement. The accounting director still has to confirm each one. Once they say yes, QuickBooks posts. We start with five rooms, and October is a check month so they can see the work before it becomes the habit.
Invoice intake
Reads the PDF · not the subject line
Maison Duroty
Invoice · Produce
$1,240
Review
Sysco
Invoice · Food
$3,890
Ready
SAQ
Statement · Beverage
$2,110
Posted
Hydro-Québec
Invoice · Occupancy
$890
Review
Hours saved each month
50–70
The week of typing becomes a daily review.
Savings, year 1
$42,000
$3,500 a month, at least, from close and invoice work.
The studio
A new dish does not wait for a photographer.
A phone photo of the plate — out of the kitchen, onto the menu, the site, Instagram. Already used on food, on product, and on campaign stills for Hotel 1.
A photographer day in this market is $2,000–4,000, plus a week of waiting. A new dish can go up the same day. That is the difference between a menu that ships and a menu that sits.
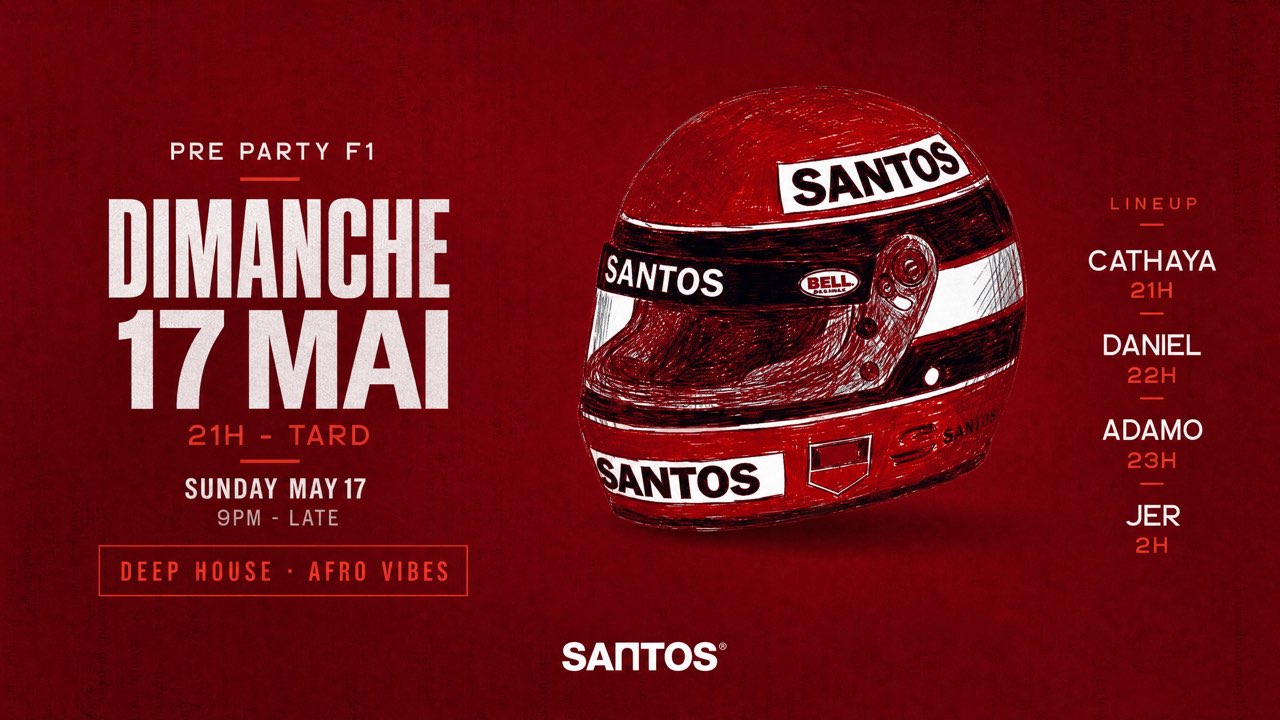
Hotel 1 · campaign still
Studio · motion, same pipeline
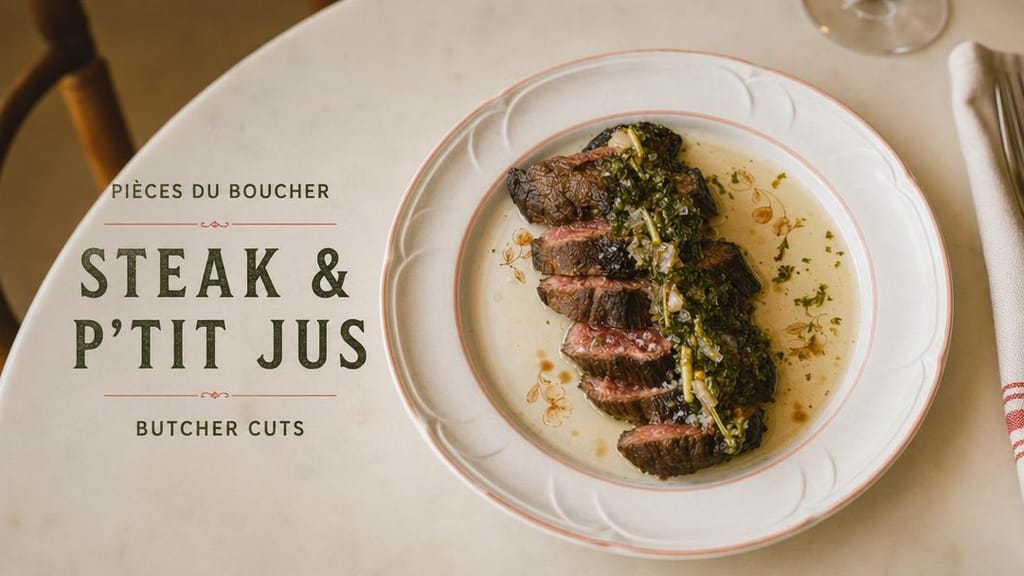
Restaurant 2 · plate
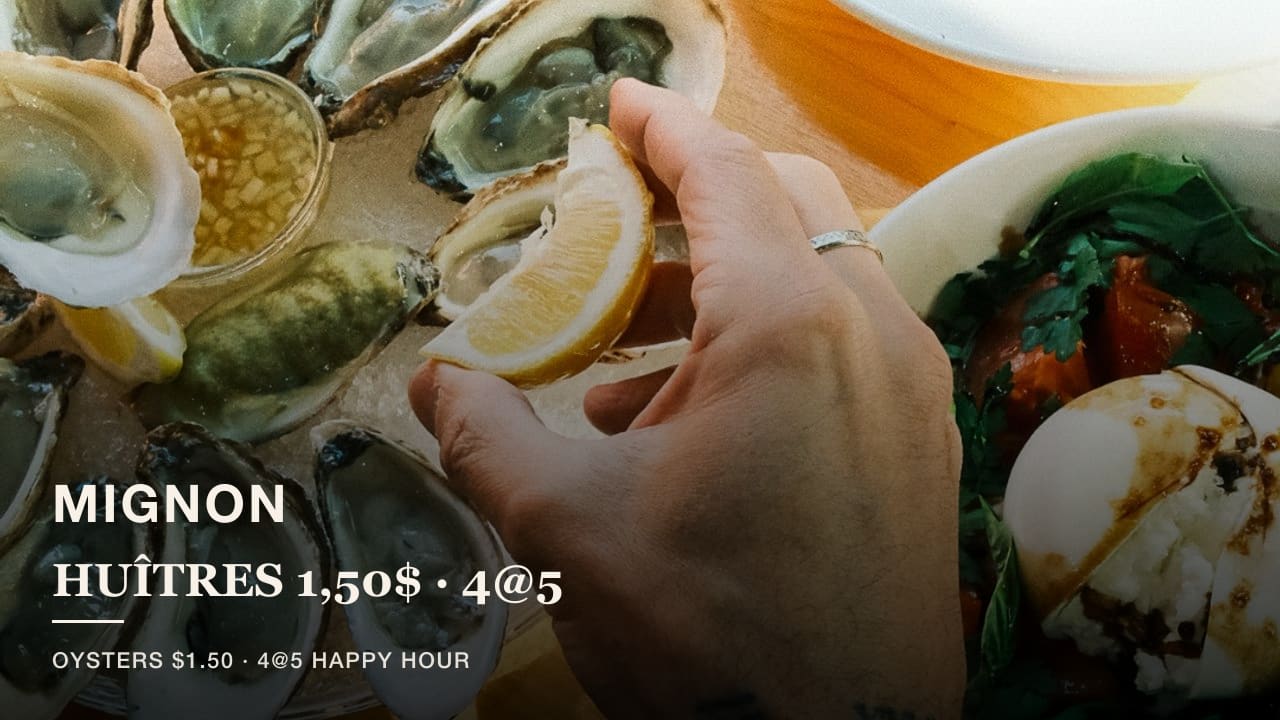
Restaurant 1 · plate
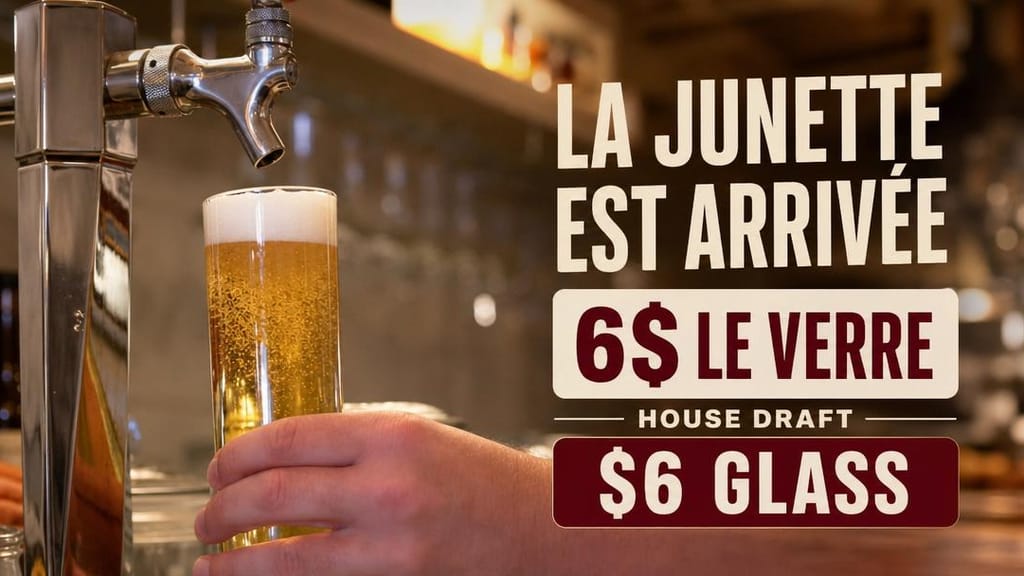
Restaurant 2 · house pour
Hospitality Group · product
Hotel 1 · campaign teaser
SEO
The sites, rebuilt as one structure. Traffic followed.
One platform. The venue sites. Domains pointed the right way. Menus that search engines can actually read. People stay on the page longer because the page is the restaurant, not a holding pattern.
Website traffic rose from 4,800 visitors in November to 31,200 in July, 146 percent more than last year. Organic Google clicks are about 4,380 a month, and Hotel 1 ranks first for its main search.
Website traffic
4,800 → 31,200
Monthly website visitors rose from November to July.
Traffic vs last year
+146%
Website traffic is up versus the same period last year.
Visitors this year
132K · +208%
Visitors this year are up 208 percent versus last year.
Google ranking
#1
Hotel 1 now ranks first on Google for its main search.
Group sites · visitors
Nov 2025 – Jul 2026
132K
visitors
+208% vs last year
327K
page views
+232%
4,380
Google clicks / mo
organic
138
articles
EN + FR
GEO
When someone asks ChatGPT where to eat, the rooms show up.
GEO is the same ontology, published: clean entities, bilingual pages, articles that answer the questions people actually type into Google and into ChatGPT. AI search visits: 12 in November, 1,285 in July.
ChatGPT
Mentions of the rooms in ChatGPT multiplied — a core search went from 2 to 34 — and visits from AI search climbed from 12 in November to 1,285 in July.
AI search visits
12 → 1,285
Visits from AI search climbed from November to July.
ChatGPT mentions
2 → 34
Mentions of a core search in ChatGPT went from almost none to a regular citation.
ChatGPT appearances
1,280 · +520%
ChatGPT appearances of the rooms increased 520 percent.
AI appearances
2,420
Appearances across ChatGPT, Perplexity, Claude, and Gemini combined.
Answer engines
Appearances
Mentions · before / after
ChatGPT recommendations
Google: #1 Hotel 1 for its main search. Steak, terrace, date night, grill — the group is now the reference those engines cite.
